We randomly generate a set of 21 data points to be fitted to a cubic using a Maple program. (Don't worry about how this program works just now. We'll get into those details later).
>
  Seed:=readlib(randomize)():
  with(stats):
  myrand := (a,b) -> evalf(a+(b-a)*(rand()/10^12)):
  points_wanted := 21:
>
  cubic_pts := proc()
    local fuzz, a, b, c, d,s,x,i;
    a:= myrand(-3,3);
    b:= myrand(-3,3);
    c:= myrand(-3,3);
    d:= myrand(-10,10);
    if (myrand(-10,10) > 0) then s:=1 else s:=-1 fi;
    fuzz := [ random[normald[0,0.5]](points_wanted)];
    x    := [ random[uniform[-3,3]](points_wanted)];
    RETURN([seq([x[i],s*(a-x[i])*(b-x[i])*(c-x[i])+d+fuzz[i]],
                i=1..points_wanted)]);
  end:
Now we can put the data to be fitted into a list, and visualize the result
with plot:
>
  data:=cubic_pts():
  plot(data, style=point, axes=boxed);
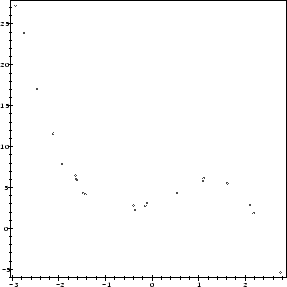
Now we have a set of 21 data points which
are to be fitted to a cubic polynomial. A polynomial function of
degree n is determined by n + 1 coefficients. So we define
>
  cub := (x,a,b,c,d)->a*x^3+b*x^2+c*x+d;
![]()
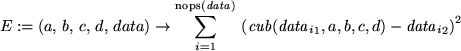
and then define the error function:
>
  E:=(a,b,c,d,data)->sum((cub(data[i][1],a,b,c,d)-data[i][2])^2,i=1..nops(data));
We have four parameters to determine, the coefficients of the function
cub. We find its values by
>
  assign(solve(diff(E(a,b,c,d,data),a)=0,
                diff(E(a,b,c,d,data),b)=0,
                diff(E(a,b,c,d,data),c)=0,
                diff(E(a,b,c,d,data),d)=0,
               a,b,c,d));
Of course, we do not see the answer, but the resulting values have already
being assigned to the coefficients a, b, c, d:
>
  cub(x,a,b,c,d);
![]()
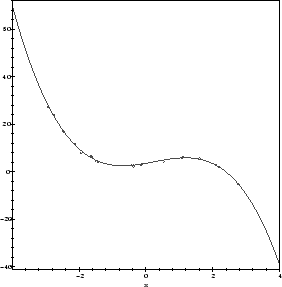
Finally, let's make a picture of the result, showing both the data and the fitted curve:
>
  with(plots):
  cplot := plot(cub(x,a,b,c,d), x=-4..4, axes=boxed):
  pplot := plot(data, style=point):
  display(cplot,pplot);
For comparison, let us find the answer using Maple's built-in statistical
package:
>
   with(CurveFitting):
   LeastSquares(data,x,curve=A*x^3+B*x^2+C*x+D);
![]()
For this particular version of least square fitting, we may once again
interpret the error function E geometrically as the square of the
Euclidean distance between
a![]() + b
+ b![]() + c
+ c![]() +
+ ![]() and
the vector
and
the vector ![]() ,
where
,
where
![]() = (x1j, x2j,..., xnj),
= (x1j, x2j,..., xnj),
![]() = d (1, 1,..., d ) and
= d (1, 1,..., d ) and
![]() = (y1,..., yn). The best fit is thus
achieved when the coefficients a, b, c and d are chosen so that
a
= (y1,..., yn). The best fit is thus
achieved when the coefficients a, b, c and d are chosen so that
a![]() + b
+ b![]() + c
+ c![]() +
+ ![]() is the orthogonal projection of
the
vector
is the orthogonal projection of
the
vector ![]() onto the subspace of
onto the subspace of ![]() spanned by
spanned by
![]() ,
, ![]() ,
, ![]() and
(1, 1,..., 1). That is to say,
the best fit occurs when the
vectors
and
(1, 1,..., 1). That is to say,
the best fit occurs when the
vectors
![]() - (a
- (a![]() + b
+ b![]() + c
+ c![]() +
+ ![]() ) and
a
) and
a![]() + b
+ b![]() + c
+ c![]() +
+ ![]() are perpendicular. You should
verify that this is the case for the solution given above.
are perpendicular. You should
verify that this is the case for the solution given above.
In both cases, you should consider why there is only one critical point for the error function, and why it is of necessity a global minimum.